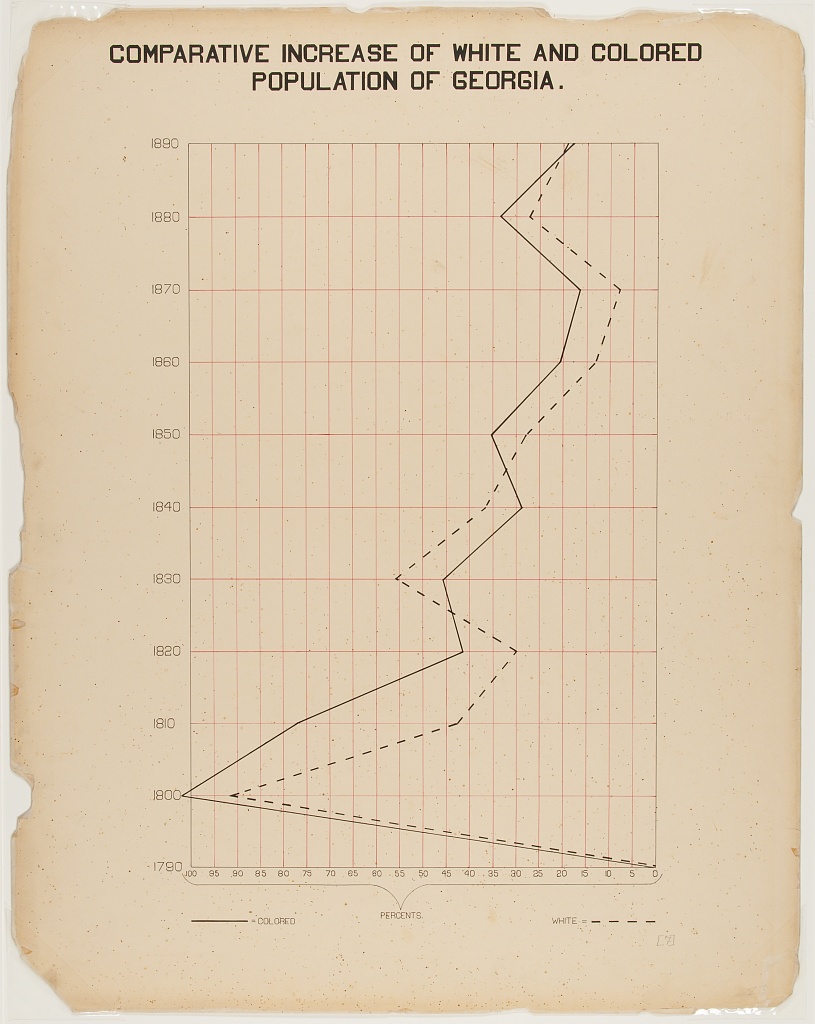
This graph is a representation of growth in population of the Colored and White races over time in the state of Georgia. Over the course of making this graph, I learned a lot of tricks about how to use R to plot, theme, and write legends. It was a struggle, essentially starting from scratch, but I am pleased to have come up with this result and look forward to creating more graphs in the future!

Original Graph: